| State | New Cases Today | Total Cases | % Growth Rate | Deaths Today | Total Deaths | as of |
| TN | 1,524 | 2,323,074 | 0.1% | 6 | 27,553 | 2022-09-15 |
See how the spread of Coronavirus is different from county to county in your state:
New Cases
Cases
Population
Growth Rates
Deaths Today
Deaths
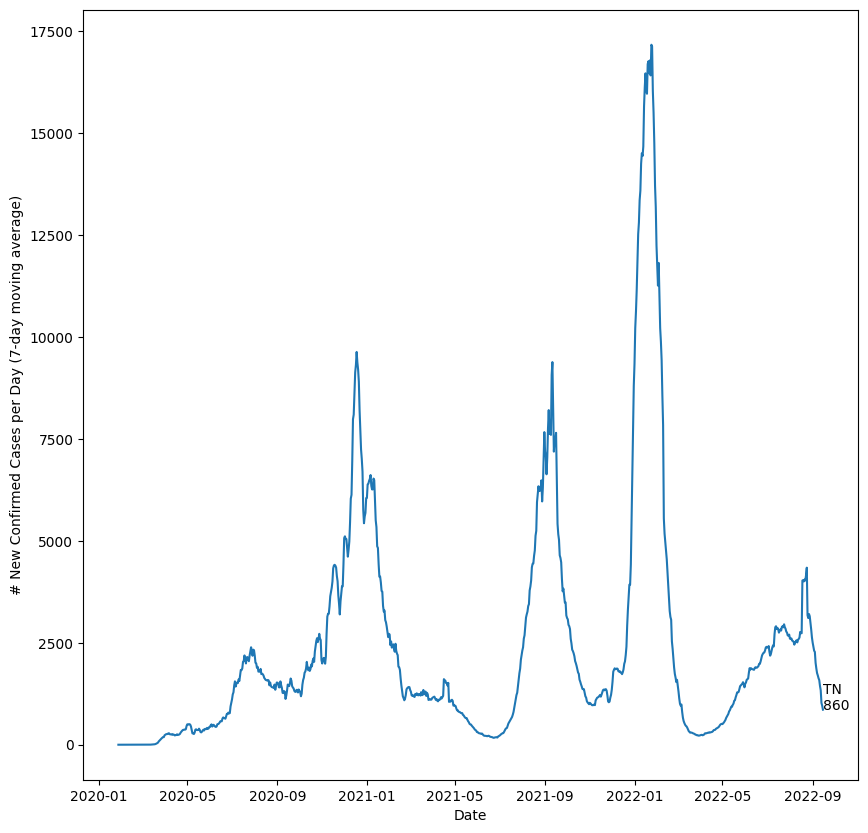
By monitoring changes over time, we can predict how the virus will spread in Tennessee and know when the curve is flattening:
New Cases per Day
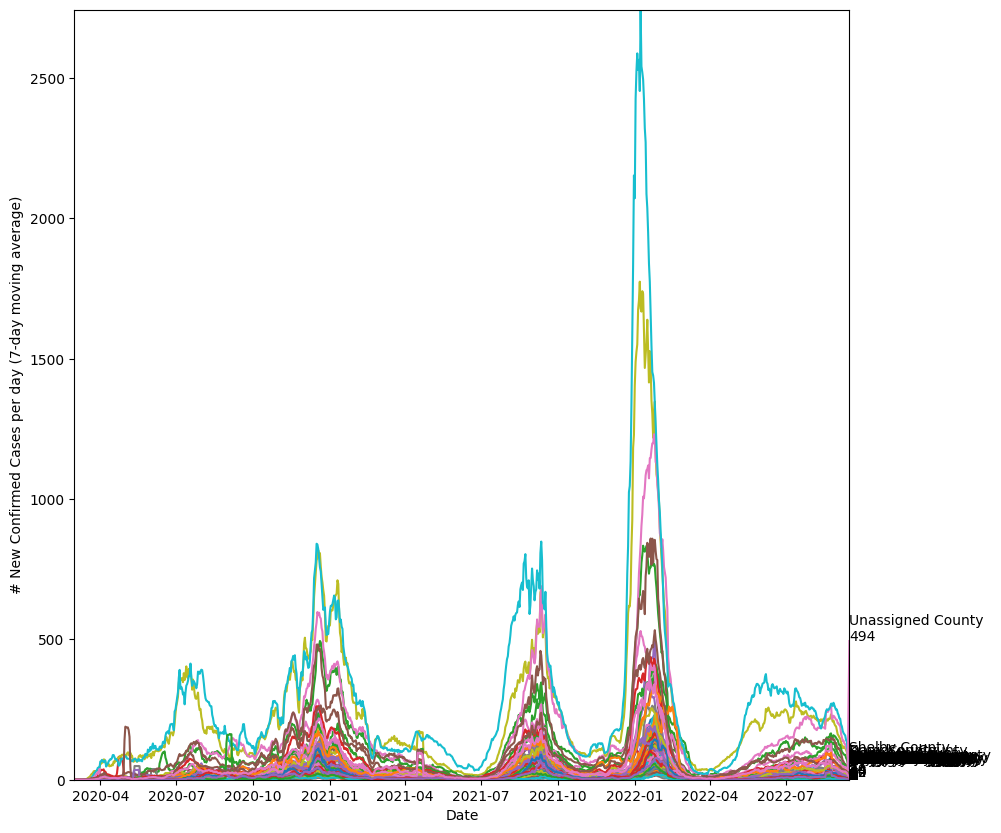
New Cases by County
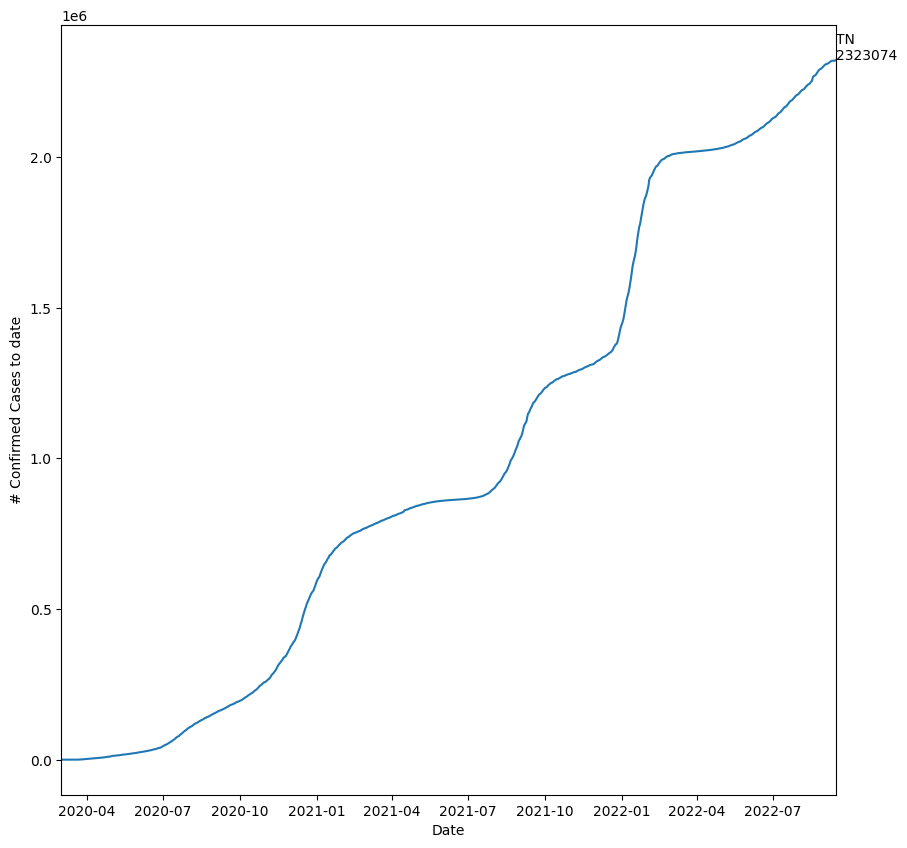
Total Cases
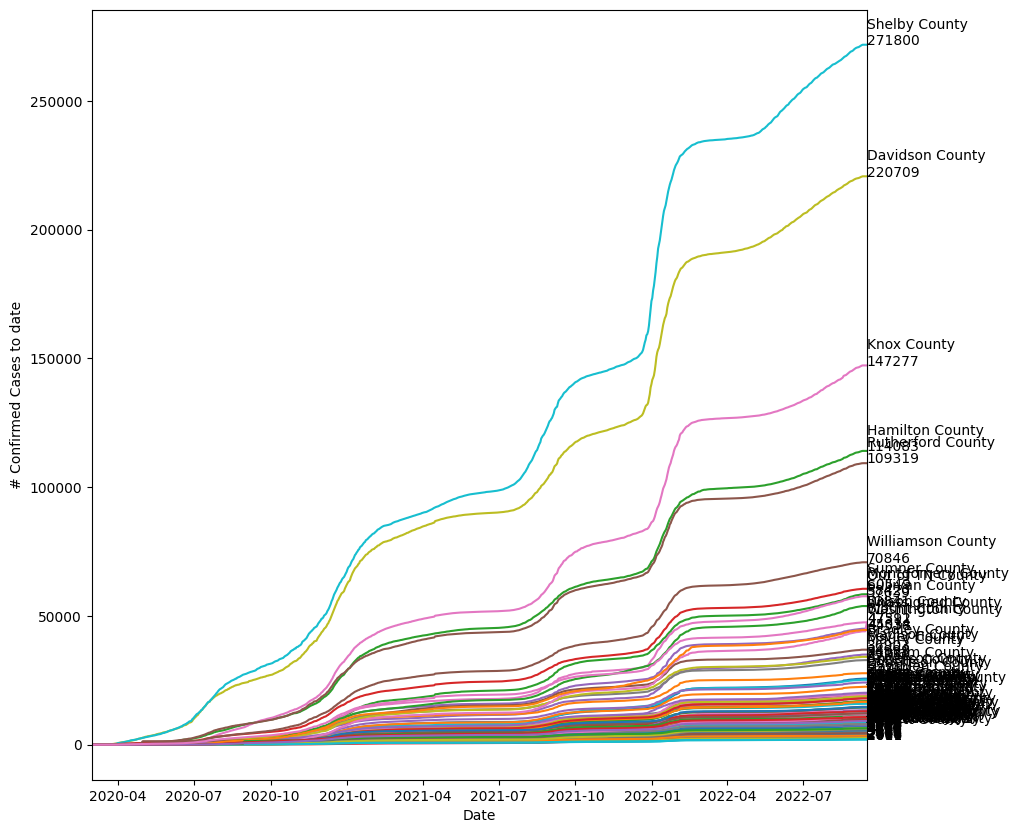
Cases by County
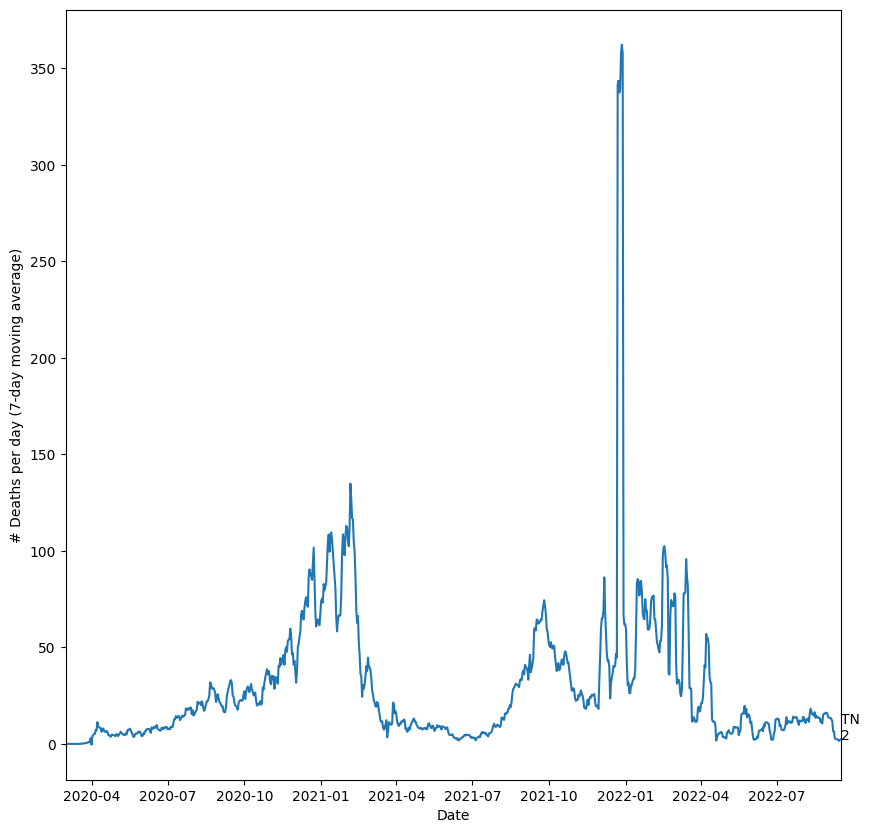
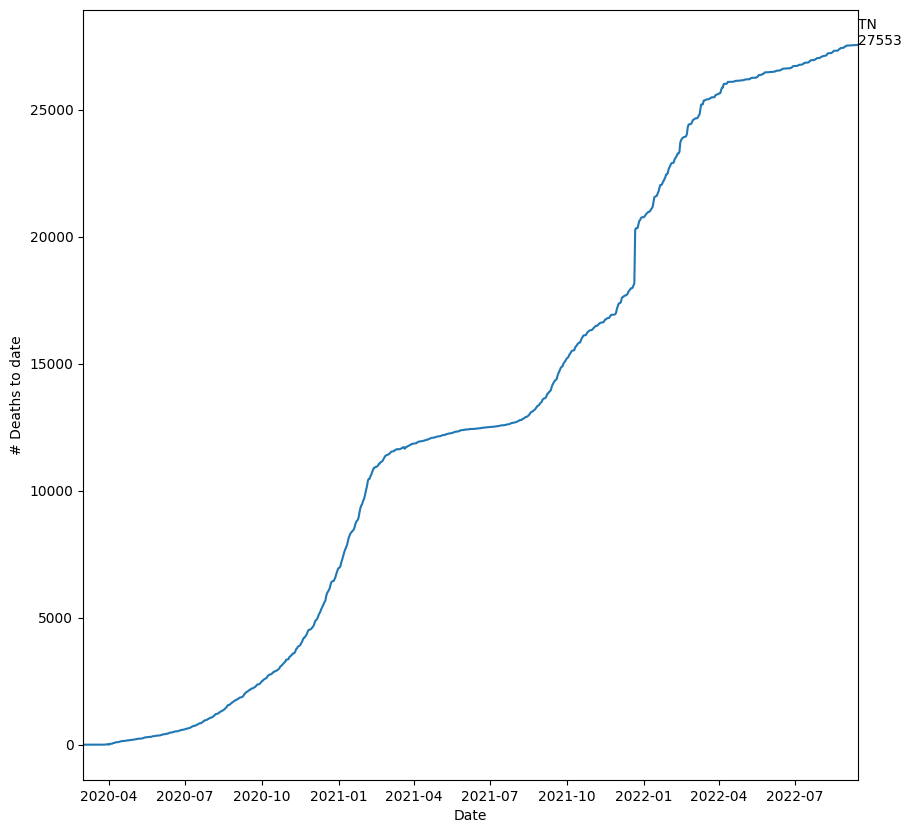
As we all hope, the loss of life due to Covid-19 will slow down and flatten out. Here is a view of the deaths in Tennessee over time:
Deaths per Day
Total Deaths
Mortality Rates
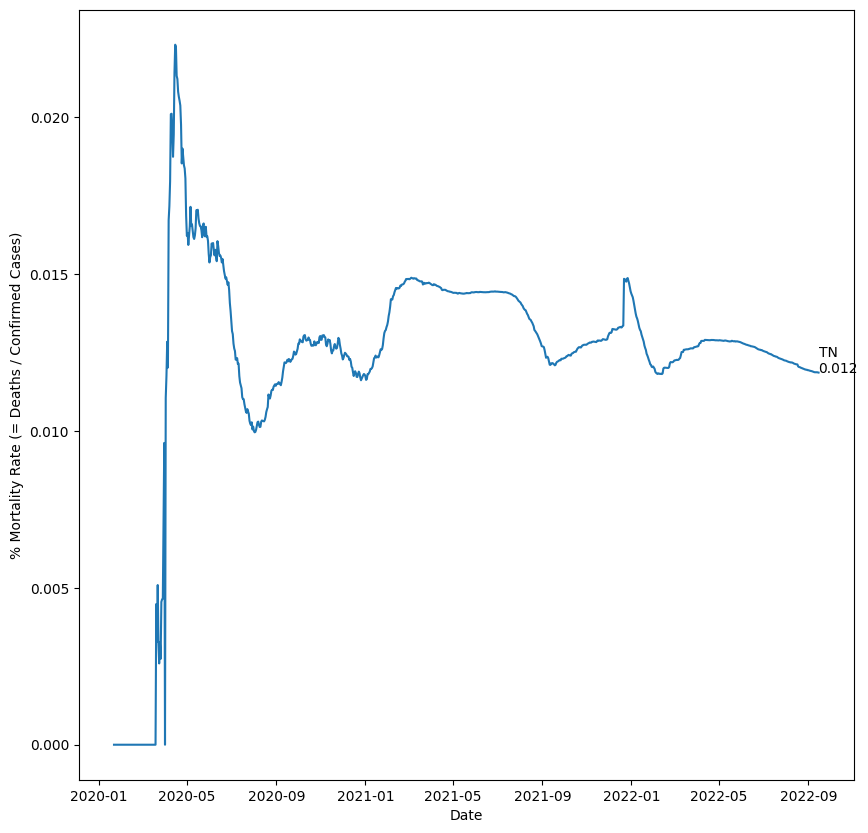
Note: Mortality Rates here are calculated as: deaths as a % of confirmed cases of Covid-19. This will be higher than the % of all Covid-19 infections that result in death, because many people who are infected with Covid-19 are asymptomatic, do not get tested, or are not included in the official statistics on confirmed cases.